

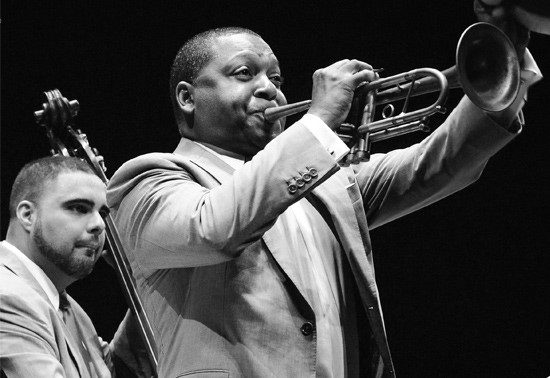


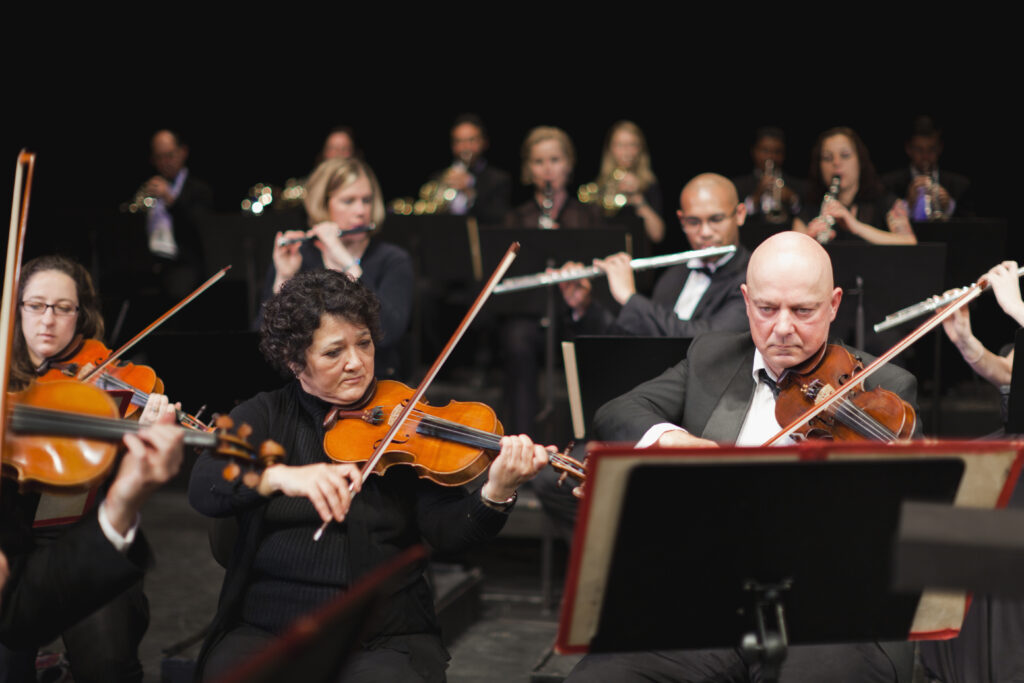
How a $60 Million Gift Is Powering Sarasota Orchestra Music Center’s Legacy for Music and Community
When Sarasota Orchestra publicly announced an anonymous $60 million philanthropic gift1—one of the largest ever given to a U.S. orchestra—the...
Discover the latest thinking from CCS Fundraising. Our articles, publications, webinars, and videos offer practical advice, industry trends, and expert insights to help you strengthen your tactics and strategy. Explore how data, experience, and innovation can shape the future of philanthropy, and find ideas to maximize your organization’s impact.
When Sarasota Orchestra publicly announced an anonymous $60 million philanthropic gift1—one of the largest ever given to a U.S. orchestra—the news reverberated far beyond Florida’s...

Improve nonprofit donation forms by reducing friction, simplifying the giving experience, and addressing the common issues that prevent donors from completing their gifts.

Build a stronger donor retention and acquisition plan for 2026 with key trends, generational insights, and strategies to grow sustainable revenue.

Donor-advised funds (DAFs) have proven to be remarkably resilient in turbulent markets, but not all nonprofits benefit equally.

Discover a practical framework that turns strategic plans into focused, donor-ready priorities to strengthen alignment and accelerate fundraising success.

Learn how your nonprofit can adapt to the 2025 H.R.1 tax reforms to stay resilient and strategic in a shifting philanthropic landscape.
When Sarasota Orchestra publicly announced an anonymous $60 million philanthropic gift1—one of the largest ever given to a U.S. orchestra—the...
Improve nonprofit donation forms by reducing friction, simplifying the giving experience, and addressing the common issues that prevent donors from...
Build a stronger donor retention and acquisition plan for 2026 with key trends, generational insights, and strategies to grow sustainable...

eeping nonprofit fundraising teams motivated and engaged is key to long-term success. Explore 8 strategies for retention, professional growth, and...

Fundraisers often spend hours reconciling inconsistent or siloed CRM data. This article explains how fundraising data best practices can streamline...

Explore how organizational readiness, donor dynamics, and strategic planning shape the success of all-endowment fundraising campaigns and long-term financial resilience.

Many fundraising teams struggle with messy or siloed CRM data, causing delays and missed opportunities. Decision-ready fundraising data can guide strategy...
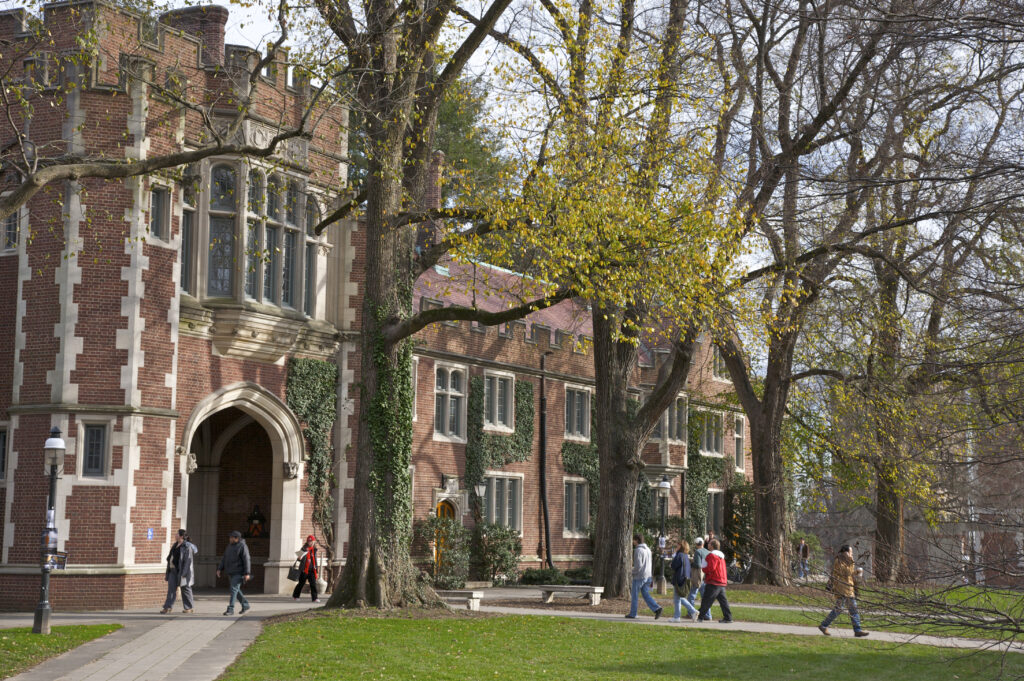
Learn how strategic stewardship and donor engagement can strengthen resilience, support students and research, and create lasting institutional impact.

Learn how to effectively analyze, refine, and refresh your donor portfolio to secure long-term fundraising success.
Of 618 organizations participating in the 2026 Philanthropy Pulse survey in late 2025, 89 self-identified as belonging to the Arts...

Of 618 organizations participating in the 2026 Philanthropy Pulse survey in late 2025, 48 self-identified as belonging to the Faith sector. Their responses provide...

Of 618 organizations participating in the 2026 Philanthropy Pulse survey in late 2025, 85 self-identified as belonging to the Primary & Secondary School sector. Their responses provide insight...